


Home >> Research Methods and Statistics
Research Methods and Statistics
Index
- Introduction: Nature and Importance of Social Research
- Philosophical Foundations: Positivism and Anti-Positivism
- Scientific Method and its Sociological Application
- Types of Social Research: Basic, Applied, Action, and Evaluative
- Research Design and Formulation of Research Problem
- Methods of Data Collection: Quantitative and Qualitative
- Sampling Methods: Probability and Non-Probability
- Scaling Techniques: Likert, Guttman, and Thurstone
- Tools of Data Collection: Interview, Questionnaire, Schedule, Observation
- Data Processing and Classification
- Measures of Central Tendency: Mean, Median, Mode
- Correlation and Regression
- Tests of Significance: t-test, Chi-square
- Report Writing and Ethics in Research
- Contemporary Issues in Research: Digital Tools and Big Data
- Conclusion
1. Introduction: Nature and Importance of Social Research
Social research lies at the heart of sociological inquiry. It provides the methodological
foundation for understanding society, institutions, and human behavior using
systematic, empirical, and analytical procedures. Unlike common sense, which often
relies on assumptions, hearsay, or personal experiences, social research seeks to
uncover patterns, relationships, and meanings through observation, measurement,
and reasoning. In essence, research allows sociologists to convert abstract ideas into
testable propositions and contributes to building, modifying, or rejecting theories.
The fundamental objective of social research is not only to explain existing social
phenomena but also to predict and control future occurrences by identifying causal
links and mechanisms. For example, understanding the reasons for high dropout
rates among rural students in India requires an empirical investigation of social class,
gender norms, economic hardship, and institutional quality—insights that are
impossible through anecdotal observations alone. Thus, research transforms
sociology from a philosophical speculation into a disciplined scientific enterprise.
Sociological research is inherently embedded within the socio-cultural context in
which it operates. The questions asked, the methods employed, and the
interpretations drawn are all influenced by the researcher’s location, worldview, and
purpose. Social research can be conducted to fulfill various needs: it can generate new
knowledge, inform public policy, improve social services, or give voice to
marginalized communities. In India, research has played a pivotal role in evaluating
programs like the Mahatma Gandhi National Rural Employment Guarantee Act
(MGNREGA), understanding caste discrimination, assessing gender violence, and
mapping urban poverty. In this way, social research contributes directly to
democratic planning and nation-building. Moreover, it helps sociologists maintain a
critical stance toward ideology, power, and domination by grounding claims in
evidence rather than opinion. A systematic approach to research also builds
cumulative knowledge, wherein each study builds upon or contests previous work,
facilitating academic dialogue and progress.
In today’s data-driven world, research has become even more central. The explosion
of digital technologies, artificial intelligence, and big data analytics has opened new
frontiers in both the scale and scope of social inquiry. Surveys can now reach millions
of respondents through online platforms; mobile tracking allows researchers to
understand real-time mobility patterns; social media content offers rich insights into
public opinion. However, these developments also introduce new ethical and
methodological challenges. Issues of privacy, consent, data ownership, and
algorithmic bias necessitate a renewed ethical commitment in the practice of social
research. Hence, the importance of scientific temper, methodological rigor, and
ethical sensitivity cannot be overstated in the contemporary era of automation and
information overload. Research methods and statistics, therefore, provide the
essential tools through which sociologists navigate the complex terrain of social life
and produce knowledge that is not only robust and reliable but also socially
meaningful and politically responsible.
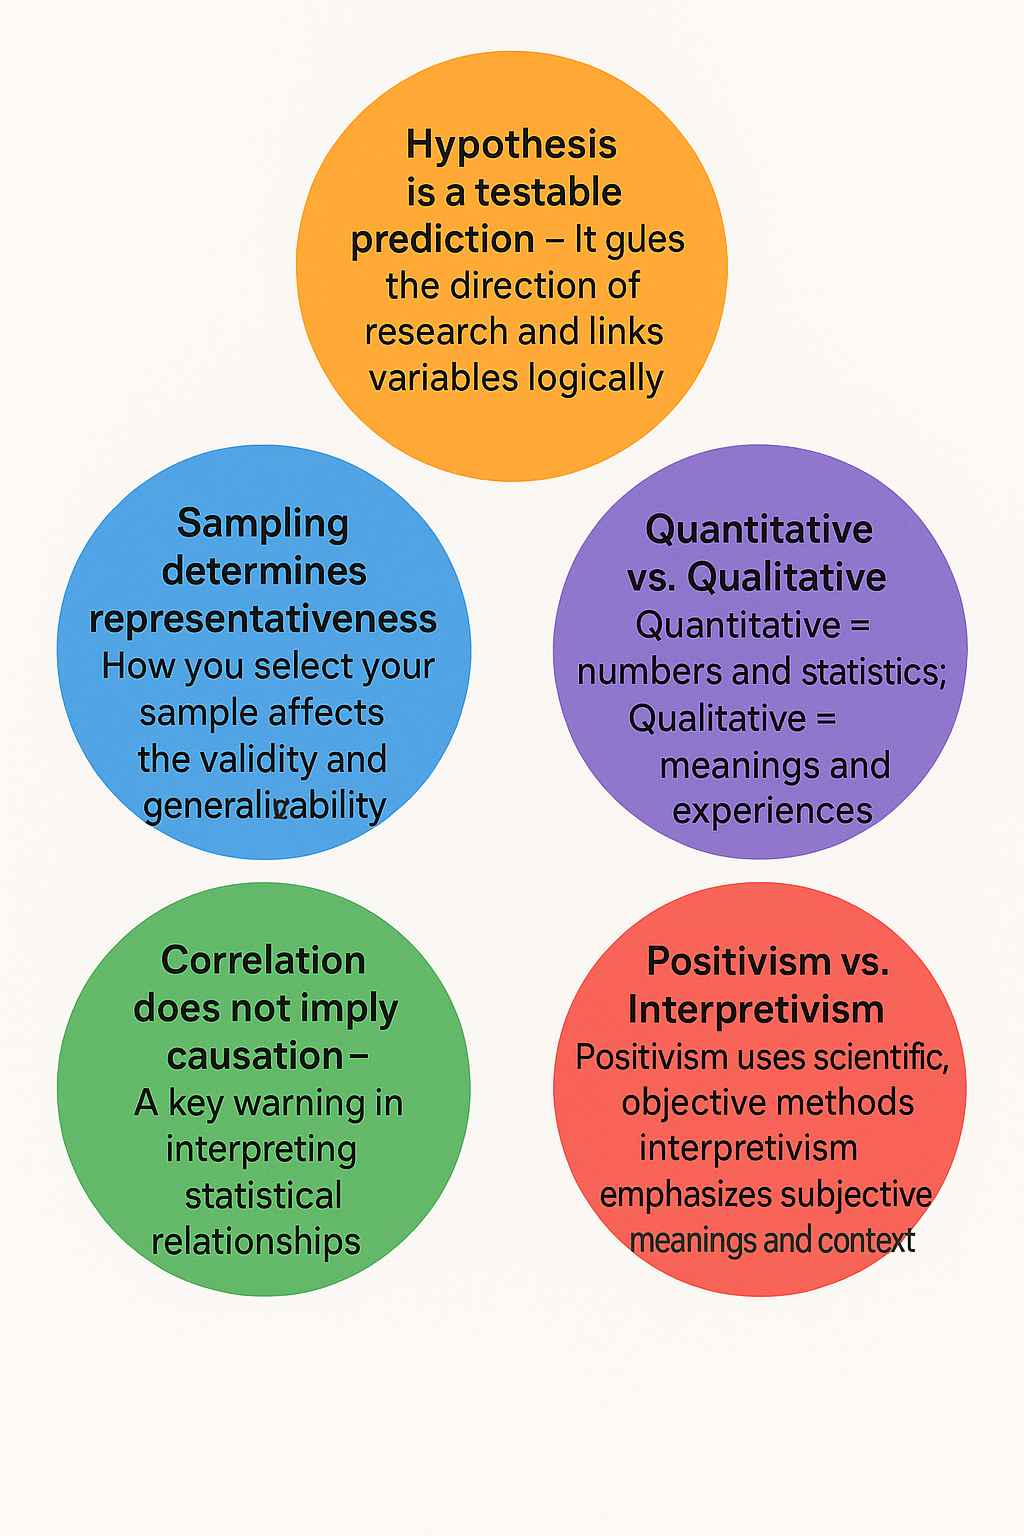
2. Philosophical Foundations: Positivism and Anti-Positivism
The methodological choices in social research are deeply influenced by philosophical
foundations. Two dominant paradigms—positivism and anti-positivism—represent
contrasting epistemological positions that have shaped sociological thinking since the
19th century. Positivism, rooted in the works of Auguste Comte, holds that society
can be studied with the same objectivity and precision as the natural sciences. It relies
on observable, measurable facts and assumes that social reality exists independently
of human consciousness. Positivist researchers emphasize quantification, structured
methods, and statistical analysis. They often use surveys, experiments, or secondary
data to examine causal relationships and test hypotheses. For example, a positivist
might use census data to study the correlation between education and fertility rates
across regions. The underlying assumption here is that patterns in social life can be
discovered, generalized, and even predicted using empirical methods.
In contrast, anti-positivism—or interpretivism—argues that the social world is
fundamentally different from the natural world and must be understood in terms of
meaning, context, and human agency. Thinkers like Max Weber, Wilhelm Dilthey,
and later Peter Berger and Thomas Luckmann argued that social reality is
constructed through interaction, symbols, and shared understandings.
Anti-positivist researchers prioritize qualitative methods such as in-depth interviews,
participant observation, ethnography, and life histories. Their goal is to uncover how
individuals interpret their world and construct meanings, rather than merely
measure external behaviors. For example, to understand why farmers commit suicide
in certain regions, interpretivists would explore cultural perceptions of honor,
indebtedness, masculinity, and state failure, rather than simply correlating suicide
rates with rainfall deficits or crop yields.
The positivism versus anti-positivism debate is not just academic—it reflects deeper
questions about what counts as knowledge, how truth is verified, and whose voice
matters. In practice, many sociologists adopt a pragmatic or mixed-method
approach, combining both quantitative and qualitative strategies. Such an approach
allows for a more comprehensive understanding of complex social realities. For
example, a study on urban migration might use surveys to map demographic trends
and ethnographic interviews to explore the lived experiences of migrants. This
methodological pluralism reflects the dynamic and multi-layered nature of society
and acknowledges that no single method can capture the full range of human
experience. As such, the philosophical underpinnings of research continue to guide
not only how data is collected and analyzed but also how social knowledge is framed
and applied.
3. Scientific Method in Sociology
The application of the scientific method in sociology represents an essential
framework through which researchers attempt to produce systematic, replicable, and
verifiable knowledge about society. The scientific method refers to a logical sequence
of steps used to investigate phenomena, test hypotheses, and draw conclusions
grounded in empirical evidence. These steps typically include the formulation of a
research problem, review of literature, hypothesis formulation, data collection,
analysis, and interpretation. While originally developed in the natural sciences, the
scientific method has been successfully adapted by sociologists to study complex
social realities. It provides a structured path that disciplines subjective biases and
ensures that conclusions are based on logical reasoning rather than intuition or
ideology.
In the context of sociology, however, the application of the scientific method must be
adapted to account for the variability and interpretive dimensions of human
behavior. Human subjects are conscious, reflexive, and embedded in social and
cultural contexts, unlike physical objects in natural science experiments. For example,
a study on the voting behavior of urban youth must account for not only
demographic variables but also political socialization, peer influence, media
narratives, and symbolic associations. The sociologist must therefore be cautious
about oversimplication and remain sensitive to multiple layers of meaning. Despite
these challenges, the scientific method offers a valuable roadmap for organizing
inquiry and minimizing bias. It enables researchers to move from anecdotal
observations to structured analysis, from speculation to evidence-based conclusions.
Moreover, the scientific method fosters a culture of critical inquiry. Sociological
research involves the constant questioning of assumptions, the search for patterns,
and the willingness to revise theories in light of new evidence. This critical reflexivity
is what distinguishes scientific sociology from ideology or propaganda. For example,
the scientific investigation of caste-based discrimination must interrogate cultural
norms, institutional practices, and structural inequalities without being clouded by
popular narratives or political motivations. Importantly, the scientific method also
demands replicability and transparency, encouraging researchers to make their
methods and data public for peer review and critique. In this way, sociology as a
discipline aligns itself with the broader values of scientific temper, reason, and ethical
inquiry, while remaining open to the diversity and dynamism of social life.
4. Types of Research: Basic, Applied, Action, and Evaluative
Social research serves multiple objectives, and its classification into different types is
based on the purpose, scope, and expected outcomes of the study. Basic or
fundamental research is primarily concerned with expanding the frontiers of
knowledge. It is theoretical, abstract, and often not tied to immediate practical
concerns. For example, studying the nature of social roles in tribal communities or
exploring theories of social stratification falls under basic research. The aim here is to
contribute to conceptual clarity and theoretical advancement. Though it may not
result in direct policy recommendations, basic research forms the intellectual
backbone of sociology by providing foundational insights into how society works.
Applied research, on the other hand, is more problem-oriented and is conducted
with a view to solving specific social issues. It bridges the gap between theory and
practice by generating actionable knowledge. Examples of applied research include
studies on school dropout patterns, unemployment trends among rural youth, or the
impact of microfinance on women’s empowerment. Such research is often
commissioned by governments, NGOs, or international agencies to guide planning,
policy-making, or program implementation. Applied research demands
methodological rigor as well as practical sensitivity, ensuring that findings are relevant
to the stakeholders involved.
A third category is action research, which represents a collaborative and participatory
approach to research. Developed by scholars like Kurt Lewin, action research seeks to
bring about social change by involving the subjects of the study in the research
process itself. It is commonly used in community development, educational reform,
and participatory governance projects. In action research, researchers act as
facilitators rather than distant observers, working with communities to identify
problems, implement interventions, and evaluate outcomes. This kind of research
blurs the line between academic investigation and activism, making knowledge
production a democratic and empowering process.
Lastly, evaluative research focuses on assessing the effectiveness, efficiency, and
impact of existing programs, policies, or interventions. It uses both qualitative and
quantitative techniques to determine whether a given initiative is meeting its goals
and how it can be improved. For instance, an evaluation of the Pradhan Mantri Awas
Yojana would involve analyzing beneficiary satisfaction, cost-effectiveness, and
improvements in living conditions. Evaluative research is crucial for evidence-based
governance and accountability, helping policy-makers make informed decisions.
These various types of research are not mutually exclusive; rather, they often
complement each other in the larger ecosystem of social inquiry, offering a diverse
toolkit to address the multifaceted challenges of society.
5. Research Design and Hypothesis
A well-structured research design is the blueprint of a sociological investigation. It
lays down the plan for how a study will be conducted—from the selection of
participants and methods of data collection to the techniques of analysis and
interpretation. Research design ensures coherence between research questions,
objectives, theoretical frameworks, and empirical procedures. It anticipates potential
challenges and provides strategies to address them, thereby enhancing the credibility,
validity, and reliability of the study. Broadly, research designs can be classified as
exploratory, descriptive, diagnostic, and experimental. Exploratory design is used
when the researcher aims to investigate new or poorly understood issues, such as the
rise of digital addiction among adolescents. Descriptive design provides a detailed
picture of a phenomenon, like demographic patterns in urban slums. Diagnostic
research seeks to identify causes and solutions to a specific problem, whereas
experimental design—though rare in sociology—involves manipulation of variables
under controlled conditions to observe effects.
An integral part of research design is the formulation of a hypothesis—a tentative
explanation or prediction that can be tested through empirical investigation. A
hypothesis links two or more variables and provides direction to the research. For
example, one may hypothesize that “students from female-headed households
perform better academically due to greater parental attention.” Hypotheses can be
classified as null (stating no relationship between variables), alternative (stating a
positive or negative relationship), directional (indicating the nature of the
relationship), or non-directional (only indicating an association). A good hypothesis
is clear, concise, testable, and grounded in theoretical knowledge. It allows the
researcher to convert abstract questions into measurable inquiries, enhancing the
scientific rigor of the study.
In addition to hypotheses, research design must also address issues of sampling,
validity, and ethical considerations. The choice of sample—its size,
representativeness, and selection method—affects the generalizability of findings.
Validity ensures that the study actually measures what it claims to, while reliability
refers to the consistency of results across time and conditions. Ethical concerns, such
as informed consent, confidentiality, and non-harm to participants, are fundamental
to any research endeavor. In sum, research design is not just a technical step but a
strategic, ethical, and theoretical foundation that determines the overall success and
integrity of the sociological investigation.
6. Methods of Data Collection: Quantitative and Qualitative Approaches
Data collection is the cornerstone of social research. The methods employed must be
carefully chosen based on the research objectives, nature of the phenomenon under
study, the philosophical orientation (positivist or interpretivist), and the available
resources. Broadly, data collection methods are divided into quantitative and
qualitative categories, each with its own logic, strengths, and limitations.
Quantitative methods involve the collection of numerical data that can be statistically
analyzed to reveal patterns, correlations, and generalizations. These include surveys,
structured questionnaires, experiments, and content analysis of numeric records.
They are commonly used in large-scale studies that aim for objectivity, reliability, and
replicability. For example, a national survey on youth employment trends using
closed-ended questions can help identify macro-level associations between education
and job attainment.
In contrast, qualitative methods emphasize understanding the depth, complexity,
and contextuality of social experiences. They deal with non-numerical data such as
narratives, observations, images, and meanings. Methods such as in-depth interviews,
focus group discussions, ethnography, and participant observation allow the
researcher to gain insight into the lived experiences and symbolic worlds of
individuals. For instance, a qualitative study on dowry practices in North India
might involve spending time within families, attending ceremonies, and interpreting
how social norms are maintained or challenged. These methods are flexible,
open-ended, and iterative, allowing the researcher to adapt their tools as new insights
emerge in the field.
Rather than viewing these two categories as mutually exclusive, many contemporary
sociologists advocate for a mixed-methods approach, which combines the breadth of
quantitative research with the depth of qualitative inquiry. This methodological
triangulation enhances the robustness of findings and provides a more holistic
understanding of social phenomena. For example, in studying rural-urban migration,
surveys might help map migration patterns, while interviews could explore personal
stories of hardship, aspirations, and adaptation. Regardless of the method used, data
collection must be guided by ethical principles such as informed consent, voluntary
participation, cultural sensitivity, and the protection of vulnerable populations.
Ultimately, the choice of data collection method reflects not only technical efficiency
but also the epistemological and ethical orientation of the researcher.
7. Sampling Techniques: Probability and Non-Probability Sampling
Sampling is the process of selecting a subset of individuals, groups, or units from a
larger population to make inferences about the whole. Since it is often impossible or
impractical to study an entire population, especially in large-scale social research,
sampling allows for manageable, cost-effective, and timely data collection. The two
principal categories of sampling methods are probability sampling and
non-probability sampling, each suitable for different research goals and conditions.
Probability sampling is based on the principle of randomization, where every
member of the population has a known, non-zero chance of being selected. This
method enables generalization of findings to the broader population and is preferred
in quantitative studies that seek statistical rigor. Common types include:
- Simple random sampling, where participants are chosen purely by chance, ensuring equal likelihood of selection.
- Stratied sampling, where the population is divided into subgroups (e.g., caste, gender, income), and random samples are drawn from each to ensure representation.
- Systematic sampling, where every nth individual from a list is selected.
- Cluster sampling, where groups or clusters (like villages or schools) are randomly selected, and data is collected from all or some individuals within them
On the other hand, non-probability sampling does not use random selection and is often employed in qualitative research or when a sampling frame is unavailable. While it limits generalizability, it allows for rich, context-specific insights. Types include:
- Purposive sampling, where individuals are selected based on particular characteristics or experiences relevant to the study
- Snowball sampling, often used in studying hidden or stigmatized populations, where existing participants refer others.
- Convenience sampling, where the researcher selects whoever is readily available, often used in exploratory or pilot studies.
- Quota sampling, where researchers ensure a xed number of participants from specific categories
The choice between these methods depends on the research objectives, resources, and ethical constraints. In large-scale government surveys like NFHS or NSSO, probability sampling is essential for national-level policy planning. In contrast, a feminist ethnography on domestic violence may rely on purposive and snowball methods to reach women willing to share their experiences. Thus, sampling is both a technical and strategic act that shapes the scope, credibility, and implications of sociological research.
8. Scaling and Measurement: Likert, Guttman, and Thurstone Scales
Measurement is the process of assigning values or symbols to social phenomena in a
consistent and reliable manner, enabling comparison and analysis. In sociology,
measurement often deals with abstract concepts or “constructs” such as alienation,
trust, religiosity, or attitude toward gender roles. To quantify such constructs,
researchers use scaling techniques, which transform qualitative judgments into
quantitative scores. The most commonly used scales include the Likert Scale,
Guttman Scale, and Thurstone Scale, each based on different assumptions and
design principles.
The Likert Scale, developed by Rensis Likert, is widely used for measuring attitudes
and opinions. It presents a series of statements related to a particular issue, and
respondents indicate their level of agreement or disagreement on a symmetric scale
(e.g., strongly agree to strongly disagree). Each response is assigned a numerical value,
and the sum or average represents the respondent’s overall attitude. For example, in a
study on gender equality, Likert items might include statements like “Women should
be paid equal to men for the same work.” This method is simple to administer and
analyze, making it popular in surveys and social psychology.
The Guttman Scale is a cumulative or unidimensional scale, where items are arranged
in a hierarchical order of intensity. Agreement with a higher-level statement implies
agreement with all lower-level ones. It is particularly useful when the researcher
wants to measure progressive attitudes. For example, a Guttman scale on political
participation might include items such as: (1) reads political news, (2) discusses
politics, (3) votes regularly, (4) attends rallies, (5) runs for oce. If a person agrees
with item 4, they are assumed to agree with 1 to 3 as well. While conceptually
elegant, constructing a valid Guttman scale requires careful testing of item scalability.
The Thurstone Scale, developed by Louis Thurstone, uses the method of
equal-appearing intervals. Experts rst rate a large set of statements on a particular
attitude from least to most favorable, and then a subset of statements representing
dierent points on the continuum is selected. Respondents are asked to agree or
disagree with these statements, and their attitudes are inferred from the mean scale
value of the agreed statements. Though more complex and time-consuming, the
Thurstone method allows for a nuanced and psychometrically grounded
measurement of attitudes.
These scaling techniques help researchers convert subjective and often ambiguous
social sentiments into structured, analyzable data. However, sociologists must also be
aware of limitations such as response bias, social desirability, and cultural variation in
interpretation. Therefore, scale construction must be rigorous, validated through
pilot testing, and contextually grounded to ensure that the measurements truly
reflect the social reality being studied.
9. Tools of Data Collection: Interview, Questionnaire, Observation, and Schedule
In social research, the tools of data collection serve as the primary instruments
through which researchers gather empirical evidence. These tools vary according to
the nature of the study, the research design, the availability of resources, and the
philosophical orientation of the researcher. The most commonly used tools in
sociological research include interviews, questionnaires, observation, and
schedules—each possessing distinct methodological strengths and weaknesses.
The interview is one of the most flexible and widely used qualitative tools. It involves
a verbal interaction between the researcher and the respondent, aimed at eliciting
information, opinions, experiences, and meanings. Interviews can be classified as
structured, semi-structured, or unstructured. Structured interviews follow a
predetermined set of questions, leaving little room for deviation, and are useful for
large-scale surveys where consistency is crucial. Semi-structured interviews balance
structure with flexibility, allowing the researcher to probe deeper into interesting
responses. Unstructured interviews, often used in ethnographic or life-history
research, are conversational in tone and allow respondents to narrate their
experiences in their own words. Interviews are particularly useful for exploring
sensitive topics like caste discrimination, domestic violence, or sexuality, where trust,
empathy, and rapport-building become crucial.
The questionnaire is a structured instrument consisting of a series of questions or
statements to which respondents provide answers. It is typically self-administered
and can be distributed in person, by post, or digitally. Questionnaires are efficient for
collecting data from a large population and are widely used in quantitative research.
They can include both closed-ended questions, which oer xed response options,
and open-ended questions, which allow for elaboration. However, questionnaires
have limitations: they often suer from low response rates, and there is little
opportunity to clarify doubts or probe deeper. The wording and sequencing of
questions also influence the quality of responses, necessitating careful design and
pilot testing.
Observation involves systematically watching and recording behaviors, events, or
interactions in their natural setting. It is particularly valuable in studies of group
dynamics, rituals, non-verbal communication, and public behavior. Observation can
be participant or non-participant, and overt or covert. In participant observation, the
researcher becomes part of the group being studied, while in non-participant
observation, they remain a detached observer. For example, a study on religious
festivals may involve the researcher taking part in rituals and understanding their
symbolic meaning from within the community. The strength of observation lies in
its ability to capture real-time behavior and contextual nuances that may be missed in
interviews or surveys. However, it also raises ethical issues—especially in covert
observation—and demands high levels of skill, reflexivity, and endurance from the
researcher.
The schedule is similar to a questionnaire but is administered by the researcher or an
investigator, rather than being filled out by the respondent independently. It is
commonly used in census surveys and large-scale government data collection
exercises. Since the researcher records the responses, this tool ensures higher accuracy,
especially when dealing with illiterate or semi-literate respondents. Schedules can also
ensure clarity, prevent misinterpretation, and enhance response rates. However, they
require trained investigators and are time- and cost-intensive.
In sum, the selection of tools is a critical methodological decision that influences the
reliability, validity, and depth of data collected. Each tool must be suited to the
research problem, and in many studies, a combination of tools is used to triangulate
data and capture the multidimensional nature of social phenomena.
10. Data Processing and Classification
Once data is collected, it must be processed and prepared for analysis. This stage,
though often overlooked, is crucial for ensuring that the findings are systematic,
transparent, and interpretable. Data processing involves several sequential steps:
editing, coding, classification, and tabulation.
Editing is the rst step and refers to checking the collected data for completeness,
consistency, and accuracy. In the case of interviews or eld notes, this may involve
clarifying unclear responses or verifying transcriptions. In survey-based studies,
missing entries, illegible handwriting, or contradictory answers must be corrected or
noted. Editing ensures that only high-quality, usable data enters the analysis stage.
Coding involves assigning numerical or symbolic codes to responses so that they can
be organized systematically. In quantitative research, this often means converting
responses into digits for statistical processing. For instance, gender might be coded as
1 for male and 2 for female, or levels of agreement in a Likert scale might range from
1 (strongly disagree) to 5 (strongly agree). Open-ended responses can be thematically
analyzed and then coded into categories. The process of coding must be both
exhaustive and mutually exclusive to maintain clarity and precision.
Classification is the logical arrangement of data into categories or groups based on
shared characteristics. This process simplifies the complexity of raw data, making
patterns easier to detect. Classification may be chronological (time-based),
geographical (region-based), qualitative (based on attributes like caste, religion,
occupation), or quantitative (based on numeric values). For example, responses in a
study on marital satisfaction could be classified into categories like high, moderate,
and low satisfaction, or grouped by age, income, and education.
Tabulation refers to presenting data in tabular form for easy comprehension and
analysis. Tables organize raw numbers or coded categories into rows and columns,
allowing researchers to see frequencies, percentages, and cross-tabulations. They
form the basis for further statistical computation and graphical representation. In
modern research, tools like Excel, SPSS, R, or STATA are used to automate data
processing and tabulation, significantly reducing human error and increasing
efficiency.
Thus, data processing and classification bridge the gap between raw, unstructured
data and meaningful, actionable insights. It is a technical but indispensable part of
research that ensures order, reliability, and analytic clarity.
11. Measures of Central Tendency and Dispersion
In quantitative research, summarizing and interpreting numerical data is essential to
uncover patterns and test hypotheses. Descriptive statistics are used to condense data
sets into meaningful summaries, with two fundamental categories being measures of
central tendency and measures of dispersion.
The measures of central tendency indicate the center or average of a data distribution
and help identify a typical value that represents the data set. There are three primary
measures: mean, median, and mode.
- The mean is the arithmetic average and is calculated by summing all values and dividing by the total number of observations. It is sensitive to extreme values (outliers), which can distort the interpretation in skewed distributions.
- The median is the middle value when the data is arranged in order. It is particularly useful in distributions with outliers or non-normal shapes. For instance, median household income is often more representative than mean in a society with stark income inequality.
- The mode is the value that occurs most frequently in the data set. It is especially useful for categorical data (like religion or language) and helps identify dominant characteristics in a population.
While central tendency provides an estimate of average behavior, measures of dispersion capture the variability or spread of data. They indicate how much individual observations deviate from the average.
- The range is the difference between the highest and lowest values. Though simple to compute, it is highly affected by outliers.
- Variance measures the average squared deviation from the mean, offering insight into the spread of data points.
- Standard deviation, the square root of variance, is a more interpretable metric as it uses the same units as the original data. A low standard deviation indicates that the data points are clustered around the mean, while a high standard deviation implies wide variability.
These statistical tools are not merely mathematical exercises; they have significant
sociological relevance. For example, in assessing educational inequality, the average
scores (mean) may be similar across regions, but the standard deviation can reveal
disparities within classrooms or across social groups. Similarly, when comparing
family size in urban vs. rural areas, the median may oer a better summary than the
mean, given the influence of demographic outliers.
Hence, central tendency and dispersion work together to provide a comprehensive
picture of the data landscape, allowing researchers to describe, interpret, and
communicate fidings with clarity and precision.
12. Correlation and Regression: Understanding Relationships Between Variables
In the realm of statistical analysis, correlation and regression are powerful tools that
help sociologists understand the relationships between two or more variables. These
methods go beyond mere description, providing insights into how changes in one
variable relate to changes in another. Their value in sociological research is immense,
particularly when trying to test causal models, identify patterns of inequality, or
assess social trends.
Correlation measures the strength and direction of the association between two
variables. The most commonly used statistical tool for this purpose is Pearson’s
correlation coefficient (r), which ranges from –1 to +1. A value close to +1 indicates
a strong positive relationship (as one variable increases, the other increases), while a
value close to –1 signifies a strong negative relationship (as one variable increases, the
other decreases). A value around 0 suggests little or no linear relationship. For
example, in a study on education and income, a high positive correlation would
indicate that higher levels of education are associated with higher income levels.
However, it’s critical to remember that correlation does not imply causation—a third
factor could be influencing both variables.
In contrast, regression analysis goes a step further by not only identifying
relationships but also modeling them. The most basic form is simple linear
regression, where one independent variable (X) is used to predict the value of a
dependent variable (Y). The relationship is expressed through a regression equation:
Y = a + bX + e,
where a is the intercept, b is the slope (regression coefficient), and e is the error term.
The coefficient b indicates how much Y changes with a one-unit change in X. This
method is useful in forecasting, policy planning, and hypothesis testing. For example,
a regression model may be used to predict literacy rates based on per capita
government expenditure on education.
Multiple regression involves two or more independent variables, allowing researchers
to isolate the effect of each while controlling for others. This is particularly valuable
in sociology, where social phenomena are influenced by a web of interrelated factors.
A study on child nutrition, for instance, may include variables such as maternal
education, household income, caste, and access to health services. Regression thus
enables a nuanced understanding of causality, adjusting for potential confounders.
The validity of correlation and regression results depends on several assumptions,
including linearity, normal distribution of errors, and homoscedasticity. Violations
of these assumptions can lead to incorrect conclusions. Furthermore, both
techniques are limited to linear relationships, and complex social dynamics often
require non-linear models or qualitative insights. Nevertheless, correlation and
regression remain foundational tools in empirical sociology, helping researchers
translate abstract theories into empirically testable models.
13. Tests of Significance: Hypothesis Testing in Social Research
While descriptive statistics summarize data, inferential statistics allow researchers to
make generalizations from a sample to the larger population. This is where tests of
significance come into play. They help determine whether the patterns observed in
the data are statistically meaningful or could have occurred by random chance. The
basic logic involves setting up a null hypothesis (H₀)—which assumes no relationship
or effect—and an alternative hypothesis (H₁)—which posits the presence of a
relationship or effect. Statistical tests are then used to evaluate whether there is
sufficient evidence to reject the null hypothesis.
One of the most widely used tests is the t-test, which compares the means of two
groups to determine if they are significantly different from each other. For example, a
t-test can be used to assess whether urban and rural students differ in academic
performance. The result is expressed in terms of a p-value—if the p-value is less than
a chosen significance level (usually 0.05), the null hypothesis is rejected, and the
difference is deemed statistically significant.
The Chi-square (χ
²) test is another important non-parametric test used to examine
the association between categorical variables. It compares the observed frequency
distribution with the expected distribution under the null hypothesis. This test is
particularly useful in sociology for analyzing cross-tabulated data such as caste and
occupation, education and voting behavior, or gender and media preference. For
instance, a Chi-square test may reveal whether there is a statistically significant
association between caste background and access to government jobs.
Other significance tests include the ANOVA (Analysis of Variance), used when
comparing means across more than two groups, and Z-tests, useful when the sample
size is large and standard deviation is known. F-tests are used in regression analysis to
assess the overall significance of the model. Each of these tests comes with its own set
of assumptions and limitations, and selecting the appropriate test requires a clear
understanding of the data, the research question, and the level of measurement of the
variables involved.
significance testing helps maintain scientific rigor and objectivity. However, it should
not be the sole criterion for judging the value of research. A statistically significant
result may be substantively trivial, and an insignificant result may have theoretical or
policy relevance. Sociologists must therefore combine statistical findings with
theoretical interpretation, ethical awareness, and critical reflexivity to generate
meaningful knowledge.
14. Report Writing and Ethics in Social Research
The nal stage of the research process is the communication of findings through
report writing, which serves as both a documentation and dissemination tool. A
well-written research report reflects clarity of thought, methodological rigor, and
analytical depth. It allows peers, policy-makers, and the public to evaluate the study,
replicate the methodology, and apply the insights to practical or theoretical concerns.
A good research report typically includes the following components: introduction,
statement of the problem, review of literature, methodology, data analysis, findings,
conclusions, recommendations, and references.
The introduction lays out the research problem, its significance, and objectives. The
literature review contextualizes the study within existing scholarship, identifying gaps
the current research aims to ll. The methodology section explains the research
design, tools of data collection, sampling strategy, and analytical techniques used.
This section must be detailed enough to ensure transparency and reproducibility.
The analysis and findings present the core empirical results, supported by tables,
graphs, or qualitative excerpts. This is followed by a discussion, which links findings
to theoretical frameworks and broader implications. Finally, conclusions and policy
recommendations synthesize the insights and suggest ways forward.
Equally important are ethics in research, which govern the moral obligations of
researchers toward participants, society, and the discipline. Key ethical principles
include informed consent, where participants voluntarily agree to take part after
being made aware of the study’s purpose and procedures; confidentiality, where
personal data is protected from unauthorized access; and non-maleficence, where the
researcher ensures no physical, emotional, or reputational harm comes to
participants. These concerns are especially acute in vulnerable
populations—children, survivors of violence, or those under surveillance.
With the rise of digital technologies, new ethical dilemmas have emerged, such as
data scraping, digital consent, AI-based profiling, and algorithmic bias. Researchers
working with social media data, for example, must decide whether publicly available
posts can be ethically analyzed without consent. Institutional Ethics Committees
(IECs) now play a crucial role in reviewing research proposals to ensure compliance
with ethical standards. Moreover, the research report must acknowledge limitations,
disclose conflicts of interest, and give credit through proper citation to maintain
intellectual integrity.
Thus, report writing is not merely a formal requirement but the culmination of the
entire research process. It bridges the gap between empirical findings and societal
application, while ethics ensures that the production of knowledge is just, respectful,
and socially responsible.
15. Contemporary Issues in Research: Big Data, Artificial Intelligence, and Digital Sociology
In the 21st century, social research is undergoing a radical transformation driven by
technological advancements, especially in the areas of Big Data, Artificial Intelligence
(AI), and Digital Sociology. These developments are not just innovations in method,
but shifts in the very epistemology of research—reshaping how knowledge is created,
validated, and used.
Big Data refers to extremely large and complex datasets that cannot be processed
using traditional statistical tools. This data is often generated through digital
interactions such as social media posts, mobile phone usage, online transactions,
satellite imagery, and sensor networks. For sociologists, Big Data opens new avenues
to study behavior in real-time and at scale. For instance, analyzing Twitter
conversations during elections can provide insights into public sentiment,
polarization, and the spread of misinformation. Similarly, mobile phone data can
track internal migration, urban mobility, or health behavior during pandemics.
However, Big Data also raises serious concerns about data privacy, consent,
surveillance, and digital divide—as marginalized communities may be either
over-surveilled or completely absent in such datasets.
Artificial Intelligence (AI), especially machine learning and natural language
processing, is increasingly being used to analyze unstructured data—such as text,
images, or videos—at unprecedented speed and accuracy. AI tools can now classify
documents, detect sentiments, and even predict behaviors based on complex
patterns. For example, algorithms can be trained to identify patterns of hate speech,
cyber bullying, or online radicalization. AI can also assist in automating coding,
pattern recognition, and statistical modeling. However, AI-based methods are not
neutral—they carry the biases of their creators and datasets. Predictive models used
in policing or hiring may replicate existing social inequalities if not critically audited.
Hence, the rise of AI demands a reflexive sociology that interrogates the politics of
algorithms, the opacity of machine decisions, and the dehumanization of social
processes.
Digital Sociology has emerged as a subfield that explicitly focuses on how digital
technologies are shaping society and how sociologists should study this
transformation. It includes the sociological study of the internet, digital labor,
platform capitalism, virtual communities, and datafication of everyday life.
Traditional research tools like interviews or observations are now being augmented
with digital ethnography, social network analysis, and text mining. For example,
platforms like Reddit, Facebook, or Instagram oer sociologists a wealth of data on
identity construction, social movements, or consumer behavior—but also demand
new ethical frameworks to handle this data responsibly.
India offers a unique terrain for digital research. With over 800 million internet users
and growing digital literacy, social scientists can explore rural digitization, fintech
inclusion (like UPI and Aadhaar), online education, and digital caste politics. Yet, the
digital divide persists—marginalized castes, tribal groups, and women in rural areas
remain underrepresented or invisible in digital data. Thus, while technology expands
the scope of social research, it also reinforces old exclusions in new forms.
In conclusion, the contemporary research landscape is marked by exciting
possibilities and ethical complexities. The challenge for sociologists is to embrace
these new tools without losing the critical, humanistic, and context-sensitive ethos of
the discipline. The digital age does not eliminate the need for fieldwork, narrative
depth, or ethical reflexivity—it simply expands the toolkit and the terrains of inquiry
16. Conclusion
Social research today stands at a critical crossroads—facing both expansive
opportunities and significant challenges. On one hand, there is a growing recognition
of evidence-based policy, interdisciplinary collaboration, and technological
innovation. On the other, the eld is confronting threats to academic freedom,
increasing commercial influence, and ethical dilemmas posed by data capitalism. In
this rapidly shifting terrain, the future of sociological research will depend on its
ability to remain methodologically rigorous, ethically grounded, and socially
relevant.
In India, social research must play a pivotal role in addressing the pressing issues of
inequality, communalism, environmental crisis, gender discrimination, and digital
transformation. Large-scale programs like NITI Aayog’s policy evaluation, the
National Education Policy (NEP), Swachh Bharat Abhiyan, or digital governance
through Aadhaar provide both opportunities and responsibilities for researchers.
Sociologists need to not only collect and analyze data but also question whose voices
are included, which paradigms dominate, and what structural inequalities are being
obscured or normalized. Research must move from extractive models to
participatory, decolonial, and community-led frameworks that empower those being
studied.
Methodologically, we are moving toward greater integration of quantitative and
qualitative tools. Statistical rigor must be complemented with interpretive sensitivity.
Tools like GIS mapping, digital storytelling, ethnographic filmmaking, and predictive
modeling must be integrated with classical techniques like observation, historical
analysis, and narrative interviewing. The training of future researchers should reflect
this pluralism—emphasizing not just technical skills but also critical thinking,
cultural competence, and ethical literacy.
Another significant development is the globalization of research—with increasing
collaboration across countries, institutions, and disciplines. Yet, this also risks
marginalizing indigenous knowledge systems, non-English scholarship, and local
epistemologies. Indian sociology must assert its own priorities—rooted in its unique
social reality, historical trajectory, and intellectual traditions. Scholars like M.N.
Srinivas, G.S. Ghurye, Yogendra Singh, and Veena Das have shown that
theory-building in India need not merely replicate Western paradigms but can be
contextually grounded and globally significant.
Finally, statistics in sociology should not be seen as mere number-crunching but as a
way of telling human stories—about inequality, resistance, suffering, and change.
Measures like standard deviation or regression coefficients become meaningful only
when interpreted within a socio-historical context. Numbers must not obscure lived
realities, but illuminate them.
References
- Babbie, E. R. (2013). The Practice of Social Research. Cengage Learning.
- Bryman, A. (2016). Social Research Methods. Oxford University Press.
- Goode, W.J. & Hatt, P.K. (1952). Methods in Social Research. McGraw-Hill.
- Neuman, W. L. (2014). Social Research Methods: Qualitative and Quantitative Approaches. Pearson.
- Gupta, S. C. & Kapoor, V. K. (2021). Fundamentals of Mathematical Statistics. Sultan Chand & Sons.
- Krishnaswamy, O. R. (2008). Methodology of Research in Social Sciences. Himalaya Publishing House.
- IGNOU Study Material, Block-1. (Uploaded by User).
- Creswell, J. W. & Creswell, J. D. (2018). Research Design: Qualitative, Quantitative, and Mixed Methods Approaches. Sage.
We are proud to present you this section on Research Method And Statistics. We hope this section on Research Method And Statistics will be as useful to you as it is meant to be.
|
|


 |
© 2026 sociologyguide |
 |